


Over the weekend of 22 April 2018, TSB moved the records of more than five million customers onto a new banking platform. The migration itself worked: every account transferred accurately, a fact the board would later cite with some justice, since moving a bank’s entire data estate to the penny is a genuine feat. The programme had run for years, undergone nine dress rehearsals, and reached the go-live decision, backed by attestations from executives, suppliers, and technical reviewers. The board approved. Within days, customers were locked out of their accounts, fraudsters feasted on the confusion, and the bank began an ordeal that would cost around £366 million, tens of thousands of customers, the chief executive’s job, and eventually a £48.65 million fine from the regulators. Slaughter and May’s independent review later found that the testing behind those assurances was not sufficient for the risk being taken, that performance targets had been treated generously, and that performance testing had been run on a single data centre when the live service would depend on two configured identically, which they were not.
The lesson boards most often draw from TSB is about technology risk, and that lesson is real. The more transferable lesson is about evidence. The board had a rich picture of delivery: completed rehearsals, passed milestones, signed attestations. What it did not have, and did not know it lacked, was evidence about the state of the world the delivery was supposed to produce: a platform that five million customers could actually use under load. Those are different kinds of evidence; they answer different questions, and the central failure of most board reporting is that it presents one while the board believes it is reading the other.
One pack is doing two jobs, and doing both badly
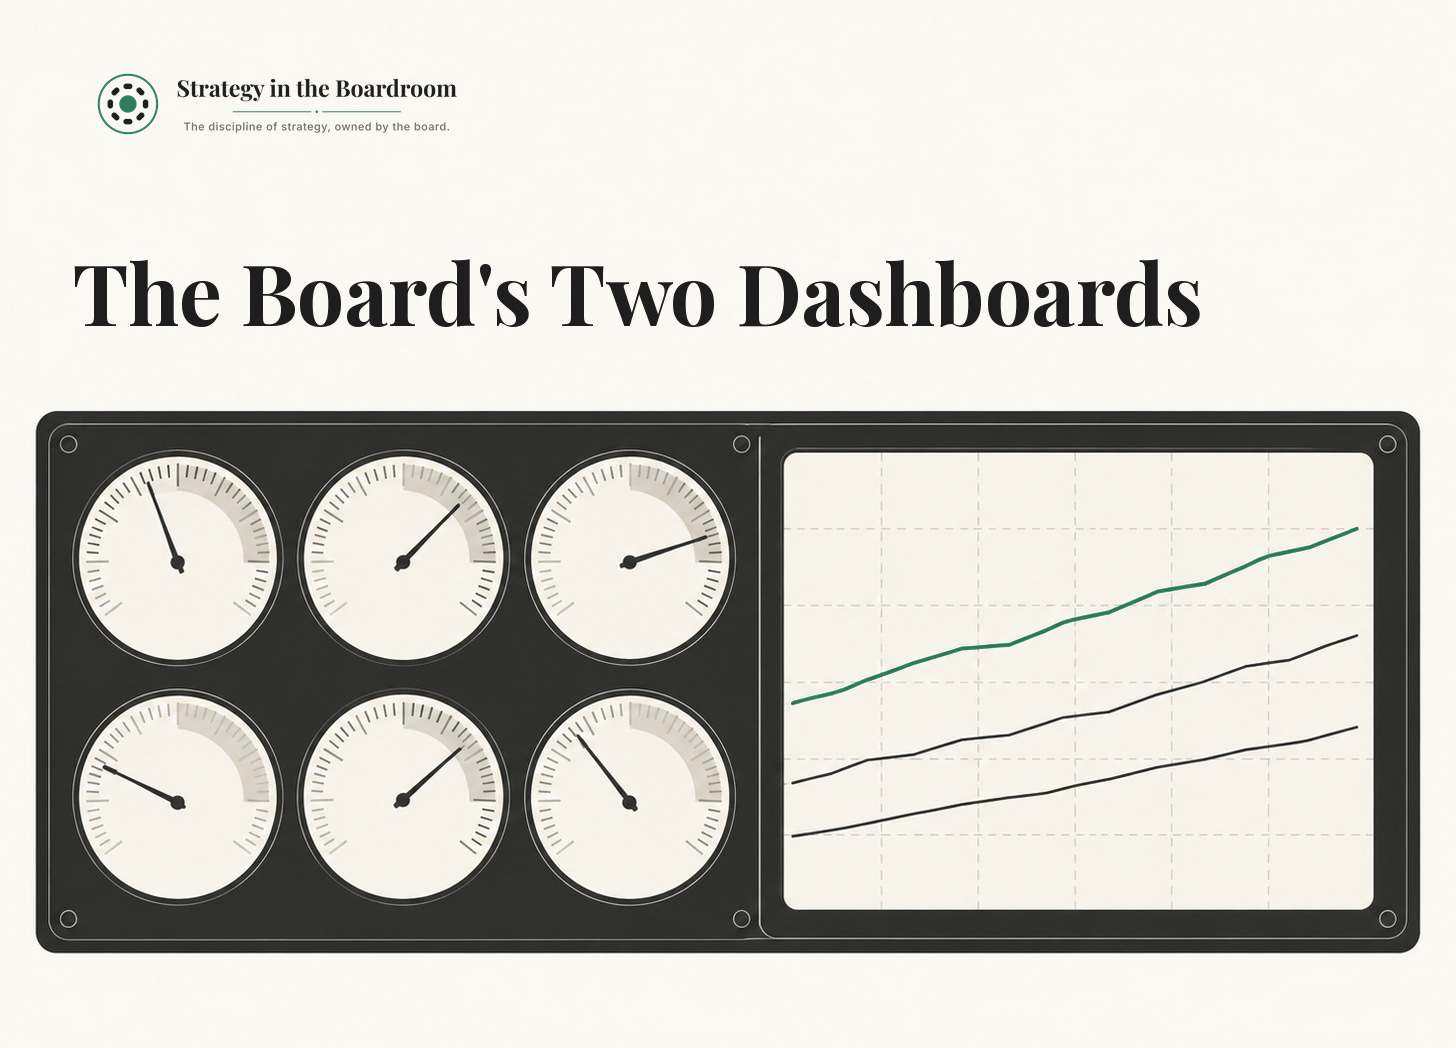
Every board is responsible for two distinct assurances. The first is that the enterprise is healthy: solvent, compliant, serving customers within tolerance, holding the confidence of colleagues and regulators. The second is that the strategy is landing: that the changes the board approved and the capital it committed are producing the outcomes that justified them. These are separate questions requiring separate evidence, yet they typically arrive interleaved in a single pack, and the packs are not small. Research by Board Intelligence puts the average board pack at roughly 288 pages, against perhaps three hours of realistic director reading time. Inside that volume, health measures and change measures sit side by side, unlabelled, so that when something turns red, the pack cannot answer the director’s first and most important question: is the engine broken, or is the change slipping? The two conditions demand entirely different responses. One calls for operational intervention and possibly a conversation with the regulator; the other calls for challenging the programme’s hypothesis. A board that cannot distinguish them will respond incorrectly to both.
The instruments for the two jobs already exist and are widely misused. Key performance indicators (KPIs) are the health instrument: measures that must stay within tolerance regardless of the strategy of the day, reviewed on exception, mostly backwards-looking by design. Objectives and key results (OKRs), or whatever change instrument an organisation prefers, are the strategy instrument: time-boxed, deliberately ambitious, and disposable, in the sense that a good one expires when the change lands and either disappears or graduates into the KPI set as a new standard to hold. The corruption runs in both directions. Steady-state targets are restated as quarterly ambitions, wasting the ambition mechanism on things that only need a threshold and an alarm. Strategic change is tracked through lagging health measures that report outcomes long after the moment to intervene has passed. When a board pack presents “maintain platform availability” and “transform the customer proposition” in the same format on the same page, both instruments have already failed.
When an organisation uses it, the Balanced Scorecard belongs to the change dashboard, not above both. Kaplan and Norton were explicit that the scorecard should carry strategic measures, the ones that describe how the strategy is meant to work, and that the diagnostic measures, which simply have to stay in range, belong elsewhere; by The Execution Premium, they were prescribing separate operational dashboards and separate meetings to review them. Read that way, the strategy map is the causal argument from which the change portfolio is drawn, and its arrows from learning to process to customer to financial results are the early-warning relay described below. The health dashboard has a different source: the business model, the regulatory perimeter, and the board’s risk appetite. The scorecard reaches it only when a change lands and its measure graduates into a standard the enterprise must now hold. The four perspectives contribute usefully to health by providing a coverage check, since a health set that is entirely financial and prudential monitors solvency while customer and people conditions that will eventually threaten it go unwatched. The corruption is the scorecard as a third artefact: maintained by a planning team, refreshed annually, reviewed ceremonially, and generating nothing the board reads. The test is blunt. If deleting the scorecard would change no measure on the change dashboard, it has not done its translation.
Three kinds of evidence, and only one of them represents value
Beneath the two dashboards sits a distinction that sounds pedantic and decides everything. Every measure a board receives is one of three things. An outcome is a change in the world: something is different for a customer, an employee, or the balance sheet, and it would remain true if every project plan were deleted tomorrow. An output is a thing produced: a platform built, a policy written, a workforce trained. A milestone is a point in a plan that has been passed: phase complete, vendor selected, go-live achieved. All three are legitimate. Outputs are evidence of production; milestones are evidence of progress; and a board approving a nine-figure investment is entitled to both. But only outcomes are evidence of value, and the causal chain connecting the three weakens as it goes. You can be certain a milestone was hit and that an output was shipped because both fall within management’s control. Whether the output produces the outcome is a hypothesis, and it is precisely the hypothesis the board was relying on when it approved the spend.
This is how transformation programmes succeed on paper and fail in reality: the plan was executed, the things were built, and the change in the world never arrived. TSB’s board held milestone and output evidence of the highest quality on the night it mattered. Nine rehearsals are delivery evidence. Attestation is delivery evidence. Readiness of the live estate under Monday-morning load was an outcome question, and nothing in the pack could answer it. The protection against this failure is not more reporting but typed reporting: every measure in the pack labelled as outcome, output, or milestone, with outcomes headlining and the other two supporting. Directors who start asking “which of the three is this?” of every green square in a programme report tend to find the exercise uncomfortably revealing, because the honest answer for most transformation dashboards is that outcomes are scarcely represented at all.
The relay that gives boards their early warning
The second discipline concerns time. Lagging indicators confirm results after the fact; leading indicators move earlier and offer the chance to intervene. A useful insight for a board is that these are relative terms arranged in a relay. Within any level, the leading indicators are the hypothesised drivers of that level’s lagging results. The lagging result at one level then becomes a leading indicator at the level above, where it is one of the drivers of a larger result. Revenue is lagging at the board; pipeline conversion leads it. Conversion is lagging for the sales function; qualified meetings lead it. Boards will always live mostly in lagging territory, and should, because their job is confirmation and accountability rather than weekly steering. But a board with no forward signals at all is reading history, and a board whose forward signals are untested is reading astrology. The driver links are hypotheses, and the mark of a serious management team is that it treats them as such: when the leading indicator moves and the lagging result eventually does not, the model is revised rather than the miss explained away.
The relay earns its keep most visibly on the board’s most-watched number. Suppose the plan commits to growing profits by 10% next year. Profit makes a poor change objective, and the reason is instructive: it is too aggregated to direct anyone. Every business unit, every cost line, and every initiative touches it, so an ambition attached to profit concentrates nothing. The board’s real question is how to decompose it. Which drivers will produce the uplift, and in what proportion: perhaps three points from volume growth in the core, two from cost-to-income improvement, two from retention, three from new proposition revenue. Set the change instruments on those drivers, where ownership is possible, and learning is fast, and leave profit at the top as the lagging confirmation that the driver hypotheses were right. The artefact that makes this governable is a contribution bridge: the profit commitment at the summit, the driver outcomes beneath it with their expected weightings, so that when a driver misses in March, the profit implication is visible in March, rather than discovered when the accounts close. The bridge is the relay made visible on one page: each driver outcome is a leading indicator for the board and, at the same time, the lagging result of whichever business unit or value stream owns it. Most boards approve the summit number every year without ever seeing the bridge. It is worth asking why, because the executive who cannot produce one is asking the board to underwrite an arithmetic total while withholding the argument.
What a board should now demand
The remedies are unglamorous and within any board’s gift, and it helps to be concrete about what good looks like. The health dashboard should hold ten to fifteen enterprise KPIs, spanning financial, prudential or regulatory, customer, conduct, and people measures, reviewed on exception rather than narrated in full each quarter. Most of these will rightly be lagging; a split of roughly four lagging measures to every leading one is a reasonable steer at board level, because the board’s job on this dashboard is confirmation, and its protection against surprise comes from thresholds and escalation rather than from watching dials move. If the pack currently carries fifty health measures, the useful question is which thirty-five nobody would miss, and the answer is usually most of them.
The change dashboard is smaller and works in the opposite direction. For each strategic priority, and a strategy that has made real choices should have no more than a handful, ask for one to three outcome measures with named owners, beneath which milestones and outputs report as supporting evidence rather than headlines. That yields a change dashboard of perhaps five to twelve outcome measures in total, and their character inverts the health set: these should be mostly leading relative to the board’s headline commitments, because their purpose is to warn while intervention is still cheap. Beneath any headline commitment, ask for the contribution bridge and for the driver hypotheses to be revisited when reality disagrees. Ask, too, for pairing on both dashboards: any measure that could distort behaviour if pursued hard, and every cost and efficiency target qualifies, should travel with its counterweight, a customer, conduct, or quality measure at the same level in the same report, because a measure that becomes a target degrades as a measure, and an unpaired one will be hit in ways the board may not enjoy discovering.
Readers of Edition 5 will recognise where this argument lives. In the Coherence Stack, Layer 3 (Strategic Outcomes) defines success, and Layer 6 (the Management System) provides the machinery for steering and learning. Measurement is where those two layers meet the boardroom, and where weakness in either becomes visible as a pack that cannot answer plain questions. A board that insists on two dashboards, typed evidence, and a visible bridge is not indulging a taste for methodology; it is doing the irreducible work of ownership: knowing whether the enterprise is well, knowing whether the strategy is landing, and refusing to let evidence of effort stand in for evidence of either.
If this is the kind of board-level strategy analysis you want more of, subscribe to Strategy in the Boardroom. I write for directors, executives, and advisers who believe strategy is a discipline the board must own, not a deck it approves once a year. Next week I will put this argument into a form you can take into your next board meeting: a downloadable guide, Monitoring Health and Steering Change: Measurement Principles for Directors, covering the two dashboards, the evidence types, and the questions that surface them. Subscribing now is the reliable way to receive it.